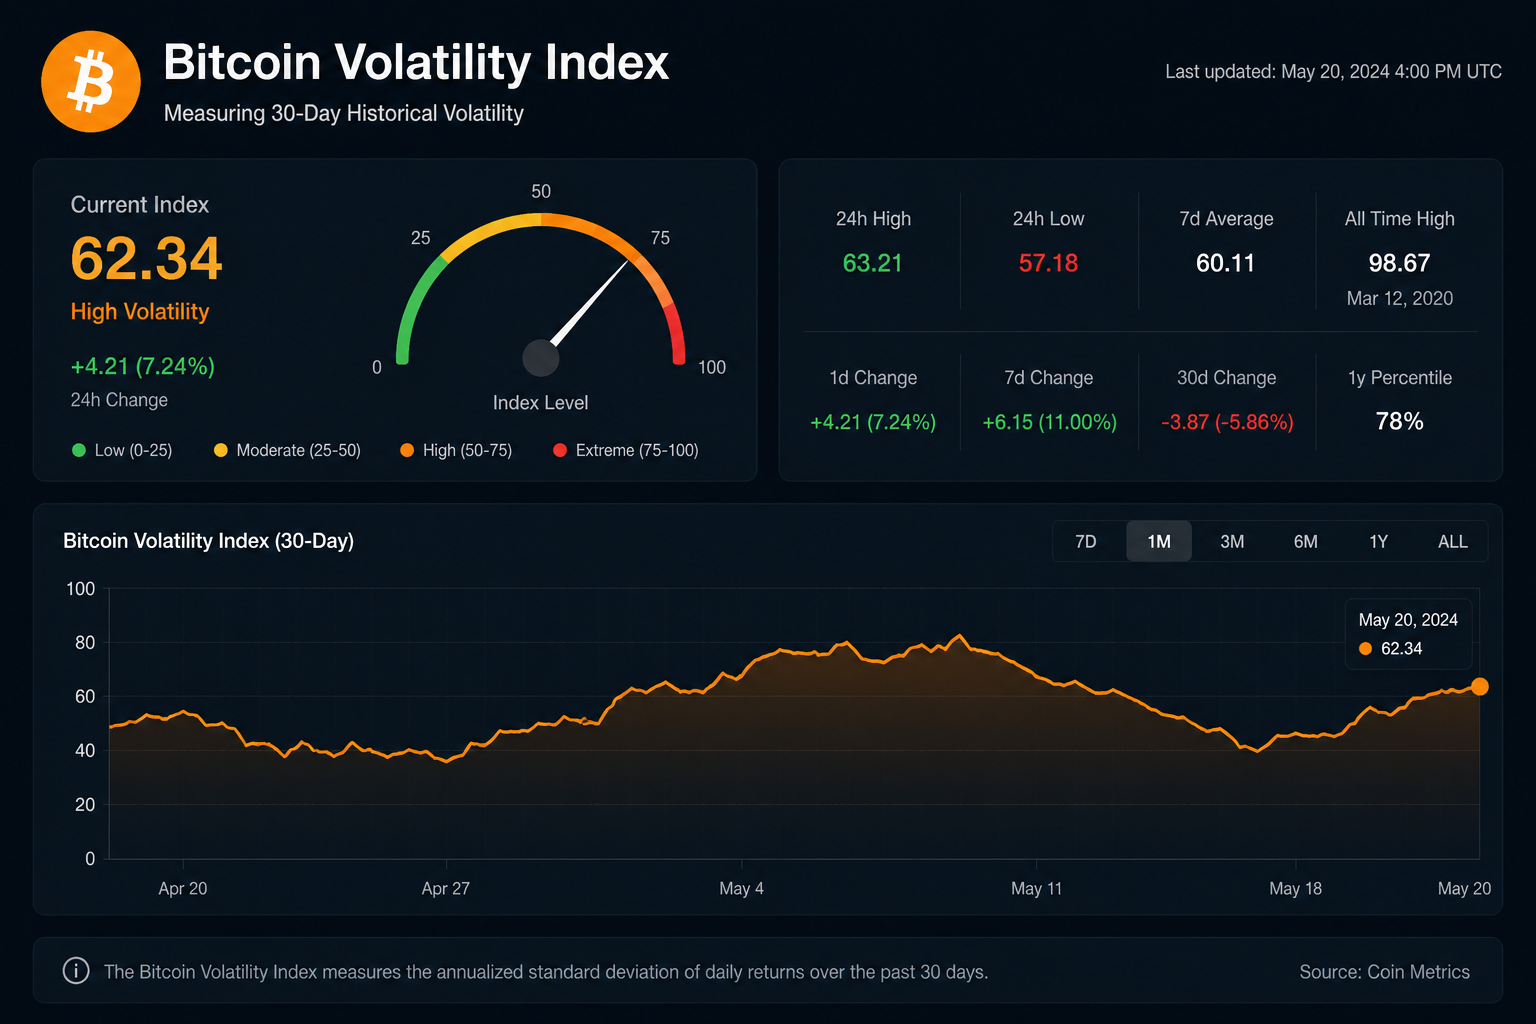
A Bitcoin volatility index helps you see how wild price swings really are. It also lets you compare that swing size against a steady benchmark like the S&P 500. Instead of guessing whether crypto still feels shaky, you can look at real numbers side by side. This view helps traders, advisors, and curious readers alike.
Over the past five years, Bitcoin swings have shifted a lot. Early years saw huge daily moves, while recent stretches have looked far calmer. So a clear Bitcoin volatility index matters more than ever for anyone weighing crypto against stocks. Whether you invest actively or just want context, this guide breaks down what the numbers mean.
Overall, volatility is just a measure of how much price bounces around. Below, we walk through how this measure works. We also cover why the S&P 500 makes a useful yardstick, and how to read a five-year view without getting lost in noise.
What a Bitcoin Volatility Index Actually Measures
At its core, a Bitcoin volatility index tracks how much price moves over a set window, often thirty days. It uses past price changes to build a single number, usually shown as an annual percentage. One reading means bigger swings, and a higher number always signals that. A lower number, on the other hand, means calmer price action.
For instance, a thirty-day realized figure looks back at daily returns and turns them into one clean score. This is the classic way most sites build a Bitcoin volatility index. Meanwhile, some indexes use options prices instead, which reflect what traders expect going forward rather than what already happened. However, both approaches try to answer the same basic question. Therefore, checking which method a source uses matters before you compare numbers across two different sites.
Also, a reliable Bitcoin volatility index updates often, since swings can shift fast after news or big trades. So always check the date on any chart before drawing conclusions from it.
Also, some trackers show both realized and expected volatility side by side. This dual view helps. Expected volatility can spike ahead of a known event, like a policy decision, even while recent price action still looks calm.
Why the S&P 500 Makes a Useful Benchmark
The S&P 500 tracks five hundred large public companies across many industries. As a result, its swings reflect the broader economy rather than one single asset. This makes it a common yardstick for judging how wild any other asset truly is.
For instance, stock market swings usually sit in a fairly steady range during calm years. Meanwhile, Bitcoin has often moved several times faster than that range, especially during its early years. However, that gap has narrowed at times as crypto matured and drew in more steady, long-term holders. Therefore, comparing the two over a full five-year stretch shows a clearer trend than any single week ever could.
Furthermore, watching the gap between these two assets over time reveals something useful. It shows whether crypto behaves more like a mature market or still trades like a young, speculative one. When the gap shrinks for a long stretch, some observers see that as a sign of growing stability. Thus, a shared five-year view beats judging crypto from a single, dramatic headline.
In short, no single number tells the full story. Together, a Bitcoin volatility index and a stock market benchmark paint a fuller picture of risk.
How Volatility Has Shifted Over Five Years
Broadly speaking, Bitcoin’s swings have followed a boom-and-cool pattern across recent years. Sharp rallies and steep pullbacks often pushed its volatility index far above stock market norms. Meanwhile, quieter stretches between those big moves let the gap shrink for months at a time.
As more banks and funds added Bitcoin to their books, larger and steadier buyers entered the market. This shift, in turn, tended to smooth out some of the sharpest daily swings. Nevertheless, sudden news could still send volatility sharply higher within a single day. A major rule change or a large hack often does the trick.
Some stretches even saw Bitcoin’s thirty-day volatility drop close to levels seen in parts of the stock market. That gap would have seemed unlikely years earlier. Watching this shift next to a Bitcoin volatility index gives investors a fuller view of how far the asset has matured. It shows more than just where price sits today.
Meanwhile, macro forces like interest rates and bond yields also shaped both markets at once. So volatility in either asset rarely moves alone. Instead, a useful comparison always checks the wider financial backdrop, not just the two assets by themselves.
How to Read a Five-Year Chart, Step by Step
First, look at the overall shape of the line. Do not focus on any single spike. One tall spike during a bad week can hide a longer, calmer trend surrounding it. A five-year view smooths that noise and shows the real pattern more clearly.
Next, compare average volatility across each year rather than day by day. If one year’s average sits far above the others, dig into what happened that year. Look for a crash or a major rule change behind the spike. Pairing this with the S&P 500’s own yearly average confirms whether the gap between them grew or shrank.
Then, watch for stretches where both lines move together. When stocks and Bitcoin swing hard at the same time, that often points to one shared cause. A macro event, not a crypto-only story, usually sits behind it.
Finally, note any period where the Bitcoin volatility index dropped sharply and stayed low for months. Also, note whether the S&P 500 stayed calm during that same stretch. Extended calm stretches often draw more attention from cautious, long-term investors than a single quiet week ever could.
Common Mistakes When Comparing These Two Assets
One common mistake is comparing volatility during a single dramatic week and calling it the full story. A single crash or rally can swing the number wildly without changing the broader five-year trend at all. So always zoom out before drawing a lasting conclusion.
Also, another mistake is ignoring that these two assets trade very differently. Stocks trade mainly during business hours, while Bitcoin trades around the clock, every day of the year. Therefore, raw daily figures need care before you compare them directly across markets with different trading hours.
Additionally, some readers forget that lower volatility does not always mean lower risk. A calm stretch can end suddenly once a big surprise hits the market. So treat any quiet period as a snapshot, not a permanent shift in character.
Who This Comparison Matters For
Not everyone needs the same depth from a Bitcoin volatility index. Active traders watch it closely, since sharp swings can shape entry and exit points within days. Meanwhile, long-term holders may only check it a few times a year, mostly to confirm their risk comfort still fits the asset.
Also, financial advisors lean on this comparison when building client portfolios. Showing a client how Bitcoin’s swings stack up against familiar stock market moves often makes risk easier to grasp than raw price charts alone. So this tool serves more than just day traders chasing short-term moves.
Journalists and researchers benefit too. A five-year Bitcoin volatility index chart, placed next to the S&P 500, offers a quick, visual way to test claims about crypto “maturing” without digging through raw trading data first.
Tools and Sources for Tracking Both Assets
Several sources publish volatility data for both crypto and stocks, ranging from exchange sites to dedicated market data providers. Exchange sites often post the most current numbers first, since the data comes straight from live trading. However, they rarely show a clean, side-by-side comparison against stocks.
A dedicated Bitcoin volatility index page paired with stock market data solves that gap. It places both lines on one chart, so the comparison becomes instant. This saves time and avoids the need to gather two separate datasets yourself. Look for a source that covers a full five-year window, updates often, and clearly labels its calculation method.
Beyond dedicated charts, some financial news sites publish periodic recap articles comparing crypto and stock swings in plain language. These recaps work well as a second check, especially for readers who want quick context without digging through raw data themselves.
Limits to Keep in Mind
No single measure tells the whole risk story, and volatility data has real limits. A thirty-day figure can shift fast after just one wild trading session. So the very latest reading might not reflect the broader trend just yet.
Moreover, volatility does not predict future price direction on its own. It measures how much price moved, not which way it will move next. Treat any Bitcoin volatility index as one piece of a bigger risk picture. Pair it with your own goals, time horizon, and comfort with sharp price swings. Mixing context with the raw number gives a far more balanced view than the number alone.
A Simple Way to Track the Comparison Over Time
Many careful investors check this comparison on a set schedule rather than only during big headlines. One simple routine might mean reviewing both volatility lines once a month. This catches real shifts in the relationship while avoiding overreaction to any single news day.
During that check, note whether the gap between the two assets is widening or narrowing. Also note whether the shift matches a real event, like a rule change or a big market shock. Over time, this habit builds a real feel for how these two markets relate to each other.
Also, you do not need fancy tools to build this habit. A simple bookmark to your favorite volatility chart works fine, as does a monthly note comparing both figures side by side. What matters most is checking the same source at the same time each month.
Final Thoughts
A Bitcoin volatility index, viewed next to the S&P 500 over five full years, tells a richer story than either number alone. By watching the long-term trend, comparing full years rather than single weeks, and pairing the data with real market context, you get a sharper read on how crypto risk has actually evolved. As more institutions enter the space, this comparison will only grow more useful for anyone weighing digital assets against traditional stocks.
So start simple. Then pick one reliable data source for both assets. Check it on the same schedule each month, and note what you see. Over time, you will build a real feel for how these two markets move together, and apart, which makes any sudden shift far easier to spot.
FAQ
- How is Bitcoin volatility usually calculated?
Most trackers use a thirty-day window of daily price changes, then convert that figure into an annualized percentage for easy comparison. - Why compare a cryptocurrency to a stock market index at all?
The S&P 500 offers a well-known, steady benchmark, which makes it easier to judge whether crypto swings are shrinking or still far wider than stocks. - Has Bitcoin’s volatility gap with stocks always been shrinking?
No. The gap has moved in both directions over the years, narrowing during calm stretches and widening again after sharp rallies or sudden shocks. - Does lower volatility mean Bitcoin is now a safe investment?
Not necessarily. Calm stretches can end quickly, and lower recent swings do not guarantee the same pattern will continue going forward. - Where can investors find reliable five-year volatility charts?
Look for established market data providers or exchange research pages that clearly explain their calculation method and update their figures regularly.