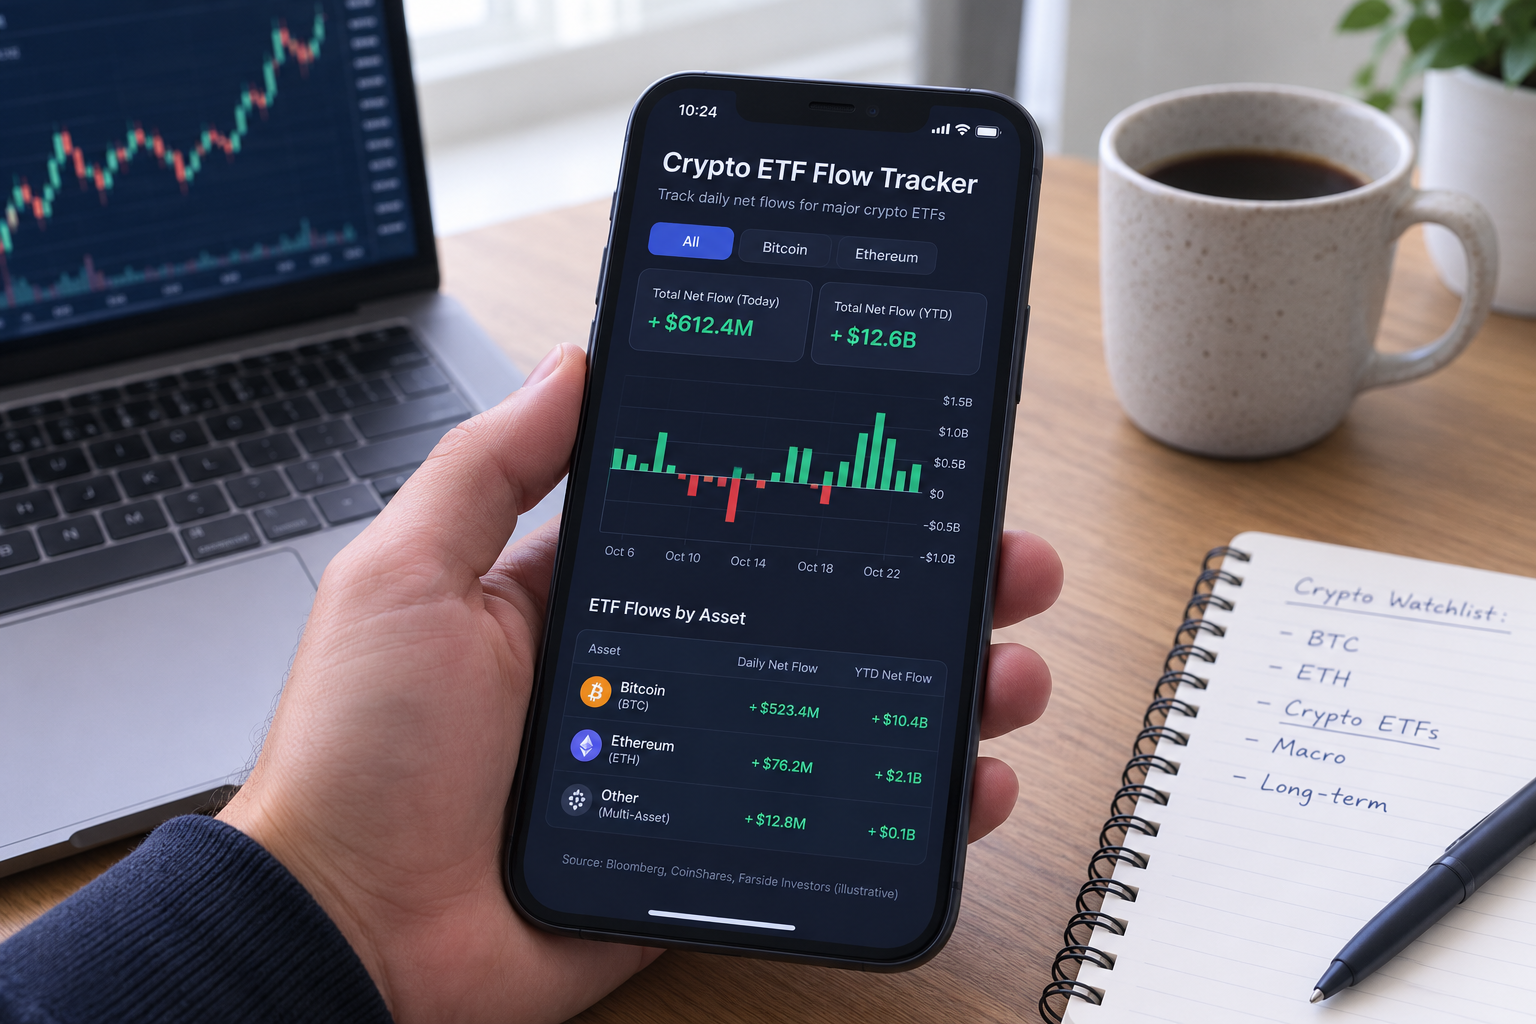
A crypto ETF flow tracker shows you where big money moves each week. It tracks how much cash flows into or out of Bitcoin and Ether funds. Instead of guessing what large investors are doing, you can just look at the numbers. This makes it a useful tool for traders, advisors, and curious readers alike.
In 2026, spot Bitcoin and Ether ETFs became a main gateway into crypto for big investors. As a result, weekly flow numbers now move markets almost as much as price charts do. So a good crypto ETF flow tracker has become must-read data for anyone who follows this space. Whether you trade daily or just want context, this data helps you see past the noise.
Overall, the idea is simple. Money either enters a fund or it leaves. Still, reading that simple signal the right way takes a bit of guidance. This guide walks through what the data means, why it matters, and how to build a habit around checking it each week.
What a Crypto ETF Flow Tracker Actually Measures
At its core, a crypto ETF flow tracker records net cash moving into or out of a fund. When buyers outnumber sellers, the fund gets a net inflow, and the reverse pushes the fund into a net outflow. Also, fund firms share this data daily, and trackers add it up into weekly views.
For instance, funds like BlackRock’s IBIT or Fidelity’s FBTC report new shares created and shares redeemed each day. Meanwhile, Ether funds post similar reports, though their totals were smaller at first. However, that gap shrank fast in 2026 as more banks warmed up to Ether. Therefore, tracking both coins together paints a fuller picture than watching Bitcoin alone.
A strong tracker also splits flows by fund name. This matters a lot. Otherwise, one big buyer can make the whole market look stronger than it is. If most of the cash comes from just one fund, that tells a different story than broad demand across ten funds. So always check who is buying, not just how much.
Also, some trackers show flows in both dollars and coin terms. This dual view helps because a fund can gain dollars while holding fewer coins, or the other way around, depending on price swings during the week. So checking both numbers side by side, using any solid crypto ETF flow tracker, avoids a false read.
Why Weekly Fund Flows Matter to Investors
Weekly flow data gives a faster read than price alone. Also, price can jump around due to news, options expiry, or a single large trade. Flows, on the other hand, show real cash moving in or out. As a result, steady weekly inflows often come before a bigger price trend.
For instance, during shaky markets, some investors quietly sell ETF shares even while the price holds steady. This gap can be an early warning sign. On the other hand, strong inflows during a flat price often mean patient buyers are stepping in. Still, spotting these patterns takes some practice. Even so, a clear crypto ETF flow tracker makes the job much easier for everyday readers.
Furthermore, comparing Bitcoin and Ether flows side by side shows rotation between the two. When Ether flows speed up while Bitcoin flows slow down, traders often call this a shift toward riskier bets. This kind of comparison is hard to do without clean, organized data in one place. Thus, a shared view across both coins beats checking each one separately.
In short, flows tell a story that price alone cannot. Together, they give a fuller read on where the market truly stands.
How 2026 Regulation Shaped ETF Demand
Throughout 2026, new rules played a big role in shaping fund flows. Lawmakers passed clearer rules for stablecoins, which pushed banks to explore crypto custody more seriously. This shift, in turn, boosted trust in regulated ETF products as a safe entry point. Meanwhile, regulators proposed new frameworks to speed up approval for new crypto funds.
As approval times got shorter, more firms launched new funds, and this raised competition among providers. Competition often helps investors through lower fees and tighter spreads. Nevertheless, not every new fund pulls in real cash. So it helps to tell true demand apart from a busy launch calendar packed with copycat products.
Some public companies also chose to hold Bitcoin directly on their books instead of buying ETF shares. This choice can pull cash away from funds during certain weeks. Watching this trend next to a crypto ETF flow tracker gives a fuller view of where big money truly lands, rather than just where it appears to land.
Meanwhile, macro news kept shaping the picture too. Interest rate changes, bond yields, and broader stock market mood all played a part in how much cash flowed toward digital assets each week. So flows never move in a vacuum. Instead, any crypto ETF flow tracker reflects the wider financial world around it, not just crypto-specific headlines.
How to Read the Data, Step by Step
First, look at the seven-day trend rather than one single day. Daily numbers can be noisy. One big trade can swing the whole picture. A weekly view smooths out that noise and shows the real direction more clearly.
Next, compare this week’s flow against the trailing thirty-day average. If this week beats that average by a wide margin, momentum may be building. Should flows fall short for several weeks in a row, demand may be cooling off instead. Pairing this check with price action helps confirm whether flows lead the market or simply follow it.
Then, check how spread out the buying is. Good crypto ETF flow data lets you see if demand is broad or narrow. Broad inflows across many funds usually point to healthier demand than cash piling into just one or two names. Narrow demand can reverse fast once that one buyer steps back.
Finally, note the mood around the news that week. A single headline about new rules or a large hack can shift flows quickly. So context always matters as much as the raw number itself. In short, no crypto ETF flow tracker reading should be judged in isolation.
Common Mistakes When Reading Flow Data
One common mistake is reacting to a single day’s number as if it were the full story. A single large trade can swing daily totals without changing the bigger trend at all. So always zoom out before drawing a conclusion from one data point.
Another mistake is ignoring fund size when comparing flows. A small fund can post a huge percentage gain from a modest dollar amount. Meanwhile, a giant fund might show a smaller percentage move that actually represents far more real cash. Therefore, always weigh both the dollar figure and the percentage change together, since a good crypto ETF flow tracker usually shows both side by side.
Additionally, some readers forget that flows reflect the past, not the future. A strong inflow week does not guarantee next week looks the same. Markets shift fast, and yesterday’s trend can fade quickly once conditions change. So treat every reading as a snapshot, not a promise.
Tools and Sources for Tracking ETF Flows
Several free and paid sources publish daily fund data, ranging from issuer websites to dedicated market trackers. Issuer sites often post the most accurate numbers first, since they come straight from the fund itself. However, they rarely combine data across every provider in one place.
Dedicated crypto ETF flow tracker pages solve that problem by pulling data from many issuers into a single view. This saves time and avoids the need to visit ten different sites each morning. Look for a source that updates daily, shows both Bitcoin and Ether funds, and breaks totals down by issuer.
Beyond dedicated trackers, some financial news sites also publish weekly recap articles that summarize flow trends in plain language. These recaps can be a useful second check, especially for readers who want quick context without digging through raw numbers themselves.
Limits to Keep in Mind
No tracker is perfect, and flow data has real gaps. Reported numbers can lag by a day due to how trades settle. So the very latest figure might still shift a bit later. Also, flow data only covers the ETF itself. Direct coin purchases, futures trades, and private deals happen outside this data entirely.
Moreover, flows do not guarantee where price goes next. They show past buying and selling, not future moves. Treat any crypto ETF flow tracker as one piece of a bigger puzzle. Pair it with on-chain data, futures data, and news about the economy. Mixing sources gives a more balanced view than trusting one number alone.
A Simple Weekly Routine for Tracking Flows
Many sharp traders check flow data on a set schedule instead of refreshing all day. One simple routine might mean reviewing the past five trading days every Friday. This catches the full week’s story while avoiding knee-jerk reactions to single-day noise.
During that check, note which fund led the week, whether Bitcoin or Ether led demand, and how this week stacked up against last week. Over time, this habit builds real pattern sense that raw numbers alone cannot give you. It also helps you spot a true shift apart from short-lived reactions to headlines.
You do not need fancy tools to start this habit. A simple spreadsheet, or even a saved bookmark to your favorite crypto ETF flow tracker page, works fine. What matters most is checking the same source at the same time each week. Consistency beats complexity when it comes to spotting real trends early.
Final Thoughts
A crypto ETF flow tracker turns scattered daily reports into one clear weekly story. By watching trends over single days, comparing funds side by side, and pairing flow data with price context, you get a sharper read on where big money sits. As rules keep evolving and new funds keep launching, this kind of tracking will only grow more useful for anyone who follows digital assets closely.
So start small. Pick one reliable data source. Check it at the same time each week, and write down what you notice. Over a few months, you will build a feel for what normal flow looks like, which makes any sudden shift much easier to spot. In the end, a steady habit beats a rushed guess every time.
FAQ
- How often does fund flow data update?
Most fund firms share their daily activity once the trading day closes, and trackers update those numbers shortly after. - What causes a sudden drop in Bitcoin fund flows?
Sharp outflows often follow profit-taking after a price rally, a risk-off shift in markets, or one large client cashing out. - Are Ether fund flows as useful a signal as Bitcoin fund flows?
They can be, though Ether funds are newer and smaller overall, which sometimes makes their weekly swings look bigger than they really are. - Should new investors trade based only on weekly flow numbers?
No single number should drive a trade alone. Flow data works best next to price trends, your own risk comfort, and the wider market mood. - Does fund flow data include private or off-exchange crypto trades?
No. This data only covers ETF share activity. It leaves out spot trades, futures, and private deals made outside the fund structure.